

CPL
--
Free · Instant · No signup
CPL, conversion rate, and cost per purchase from spend, leads, and sales.
Page updated 2026-09-04.

CPL
--
Lead to sale
--
Cost per sale
--

$3,200 in ad spend generating 80 leads produces a cost per lead (CPL) of $40.00. Of those 80 leads, 12 became purchases -- a 15% lead-to-sale conversion rate. Dividing the full ad spend by actual sales instead of leads gives a cost per sale of $266.67.
The gap between CPL ($40) and cost per sale ($266.67) is nearly 6.7x, entirely a function of the 15% lead-to-sale conversion rate -- a business that only tracks CPL without also tracking this conversion step can dramatically understate true acquisition cost.
This makes lead-to-sale conversion rate the multiplier that connects top-of-funnel ad efficiency to actual revenue-generating cost -- improving that 15% conversion rate to 20% would drop cost per sale to $200 without changing ad spend or lead volume at all.
Lead and sale are the counts you type. Quality is not scored here. This treats every lead as equal and every sale as equal -- it doesn't distinguish a high-intent lead from a low-quality form-fill, or a small first purchase from a large repeat-customer sale, both of which would matter for a fuller picture of acquisition economics.
The specific definition of 'lead' (a form submission, a qualified sales conversation, a demo request) should stay consistent across periods for this metric to be comparable over time -- changing what counts as a lead mid-campaign makes CPL trends misleading.
This is a single-period snapshot; it doesn't account for leads that convert to sales after the tracking period ends, which can understate true conversion rate for longer sales cycles.
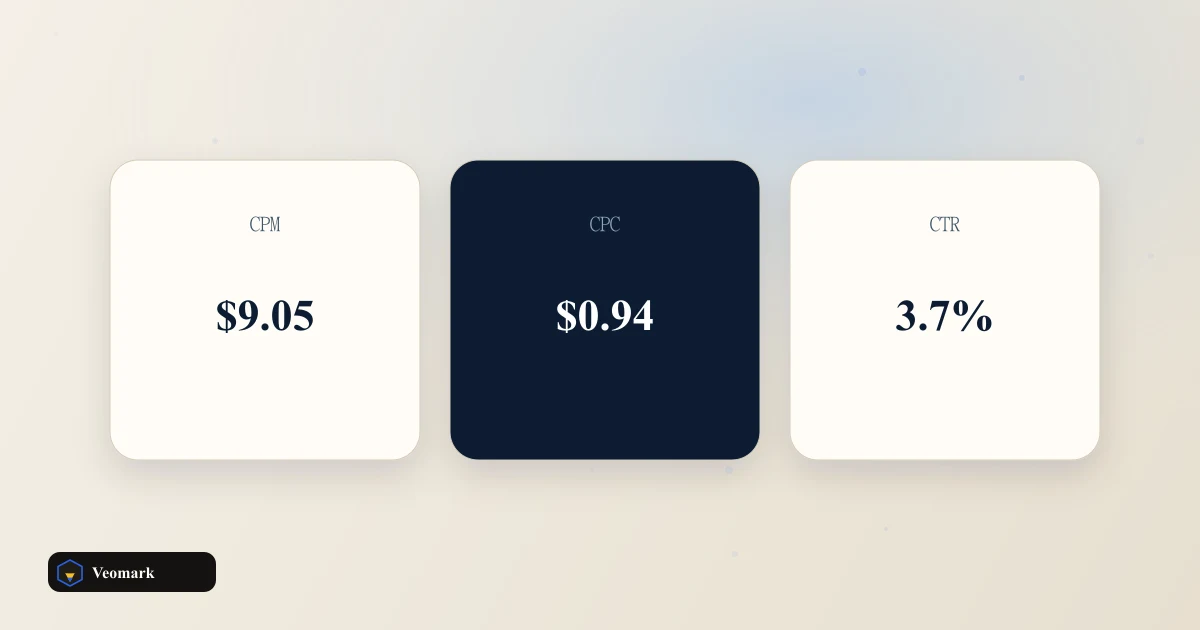
The clicks that produced these 80 leads have their own CPC and CTR efficiency worth checking separately -- see the Ad CPM/CPC/CTR Calculator for that upstream metric.
If lifetime customer value (not just the first sale) is the real economics question, the LTV:CAC Ratio Calculator extends this analysis beyond the first purchase.
Cost per sale = total ad spend / number of sales = $3,200 / 12 = $266.67 -- notably higher than CPL ($40) because it's the same spend divided by a much smaller number (sales, not leads).
Because only 15% of leads convert to sales (12 of 80). Cost per sale effectively bakes that conversion rate into the cost figure: CPL / conversion rate = $40 / 15% = $266.67. A lower conversion rate would push cost per sale even higher for the same CPL.
No. Lead and sale are the counts you type. Quality is not scored here. Every lead counts equally regardless of how qualified or sales-ready it was. If lead quality varies significantly by channel, tracking CPL and conversion rate separately by channel gives a more accurate comparison.
Either lower CPL (more efficient ad targeting or creative) or raise the lead-to-sale conversion rate (better sales follow-up, lead qualification, or nurture sequence) -- both move cost per sale, but improving a low conversion rate often has a larger proportional impact than a similar percentage improvement in CPL.
No. It's a snapshot using the sales count you enter for the same period as the spend and leads. For businesses with longer sales cycles, some leads from this period may convert to sales later, which this single-period view wouldn't yet reflect.
 Social Media Caption Emoji Cleaner & Extractor Strip emoji from a caption or list the emoji it contains, keeping the text either way.
  Amazon Product Keyword Density Analyzer Word frequency in a listing block so you can see which tokens dominate.
  TikTok Money Calculator Views, gifts, and creator-fund estimates.
  YouTube RPM & Revenue Calculator AdSense RPM/CPM by niche and geo, Shorts vs long-form, extra streams.